Dark proteome analysis using Machine Learning
- Goal
- Predict whether a protein is detectable by LC-MS/MS from properties known before any experiment
- Inputs
- 23,674 A. thaliana PeptideAtlas proteins with molecular weight, GRAVY, pI, RNA detection rate and highest TPM
- Outputs
- Six classifier families benchmarked against a majority-class baseline, plus a tuned random forest and interpretation plots
- Tools
- Python, scikit-learn
What it does
It asks whether a protein's detectability by mass spectrometry can be predicted from properties known before any experiment is run, and benchmarks six families of classifier against a baseline to find out.
Why it exists
Large parts of any proteome are never observed experimentally - the "dark" proteome. If detectability is partly predictable from sequence-derived and transcript-level properties, then absence from a dataset is not automatically evidence of absence in the organism. That distinction matters when interpreting proteomics results.
How it works
The dataset is the A. thaliana PeptideAtlas protein list: 23,674 proteins, of which 18,079 are canonical (observed) and 5,595 are not observed - a 76/24 class split that makes plain accuracy misleading on its own.
Five predictors are used: molecular weight, GRAVY hydrophobicity and isoelectric
point from the sequence, plus RNA detection rate and highest TPM from expression data.
Molecular weight and TPM are strongly right-skewed (skew 2.8 and 26.8), so both are
log1p-transformed and scaled, while the other three are scaled only. All of it sits in
a ColumnTransformer inside the pipeline, so every transformation is fitted
within each cross-validation fold and cannot leak across the split.
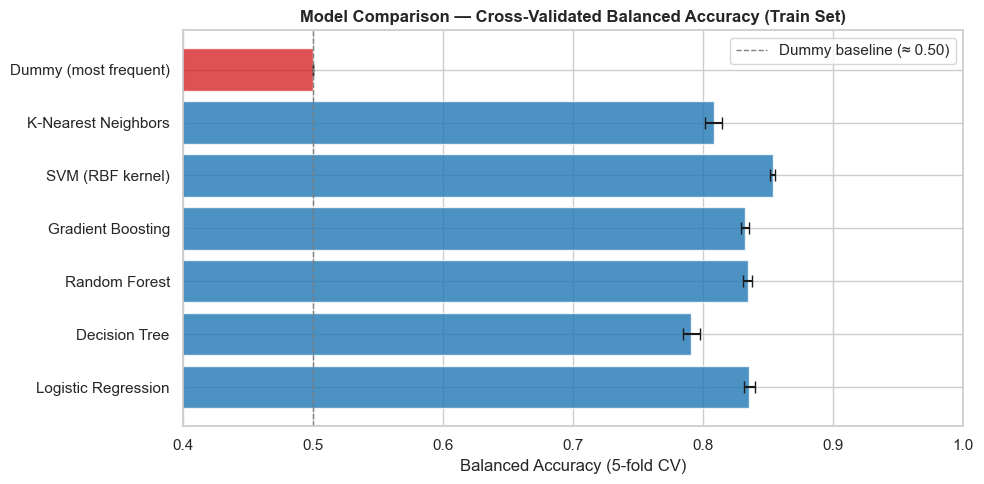
Six classifier families - logistic regression, decision tree, random forest, gradient boosting, an RBF-kernel SVM and k-nearest neighbours - are compared under 5-fold stratified cross-validation against a majority-class dummy baseline. The random forest is then tuned with a randomised search inside a nested cross-validation.
What the results say
The baseline scores 0.764 accuracy by calling everything canonical, which is exactly why both metrics are reported. Random forest leads on raw accuracy (0.897 ± 0.003), but the RBF SVM leads on balanced accuracy (0.853 ± 0.002) - on imbalanced data the two rankings disagree, and balanced accuracy is the honest one. The tuned random forest reaches 0.885 accuracy on the held-out test set, recovering 90% of canonical proteins and 82% of the not-observed ones.
The class means show where the signal comes from: proteins that are never observed are roughly half the molecular weight of canonical ones (26.4 against 52.6) and are transcribed far less consistently (46% against 92% RNA detection).
Current state
Finished and published. The dataset and a requirements.txt sit in the
repository alongside the notebook, so the analysis can be re-run as it stands.